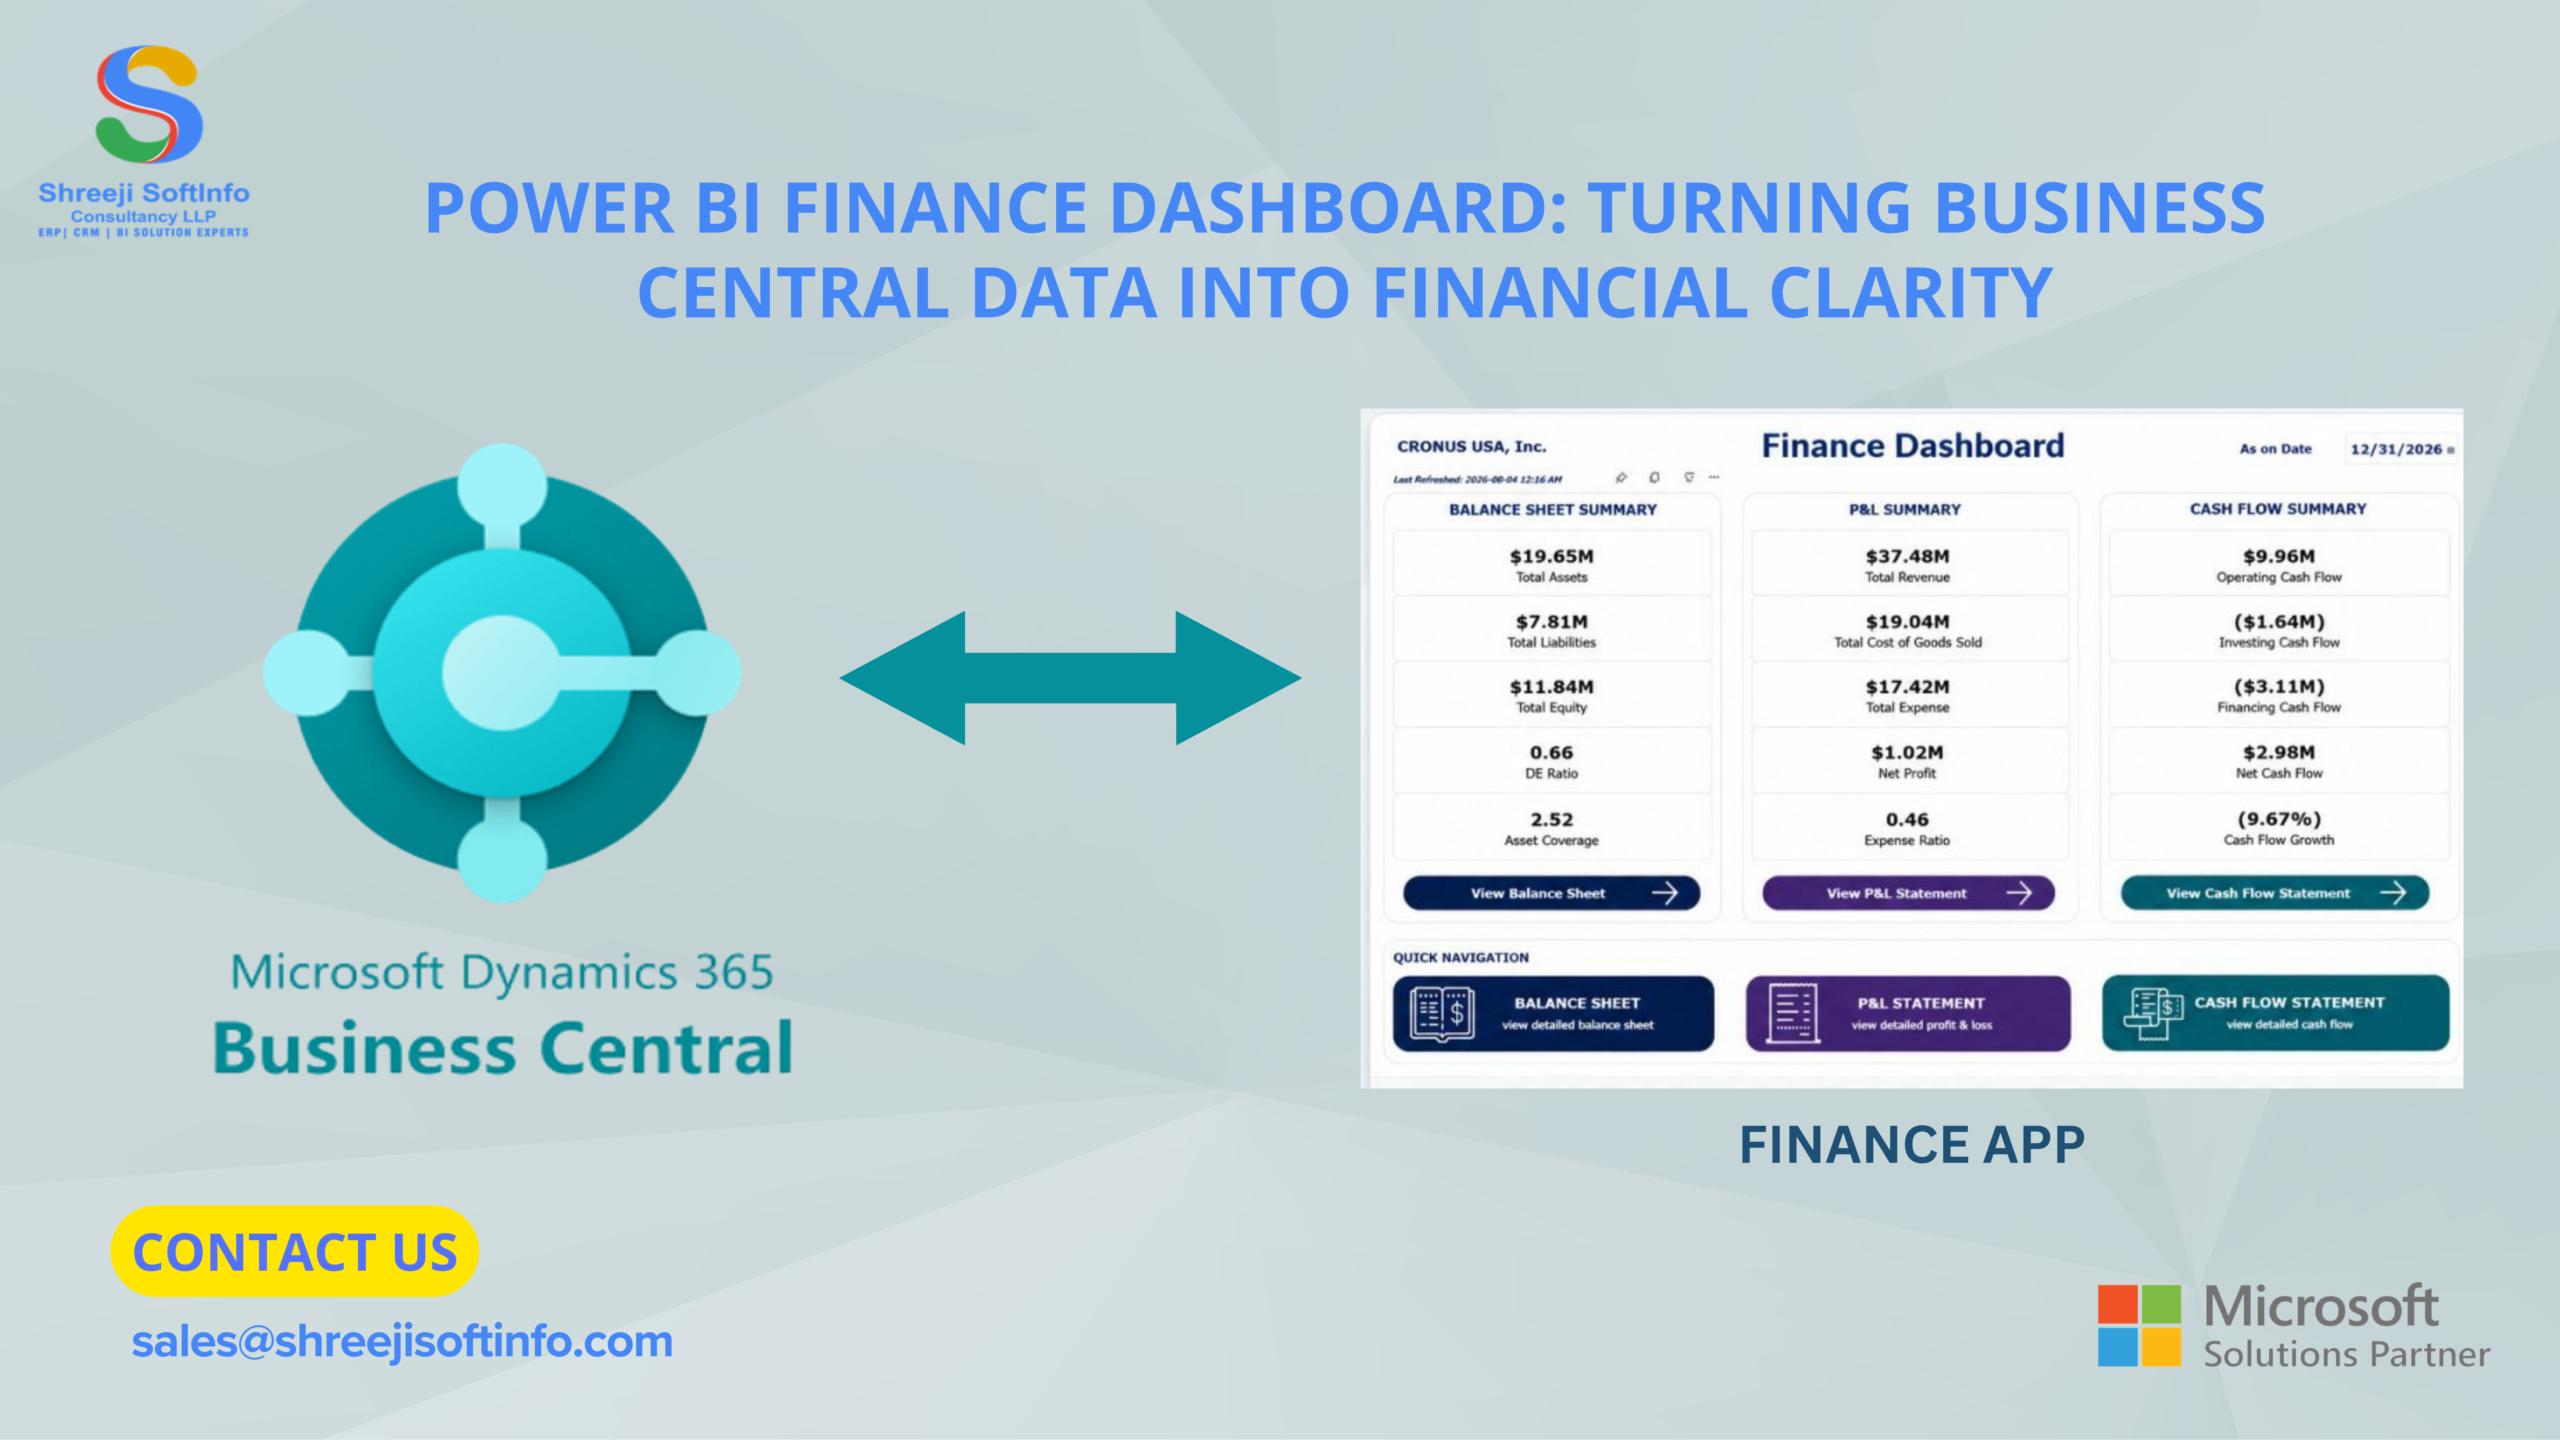
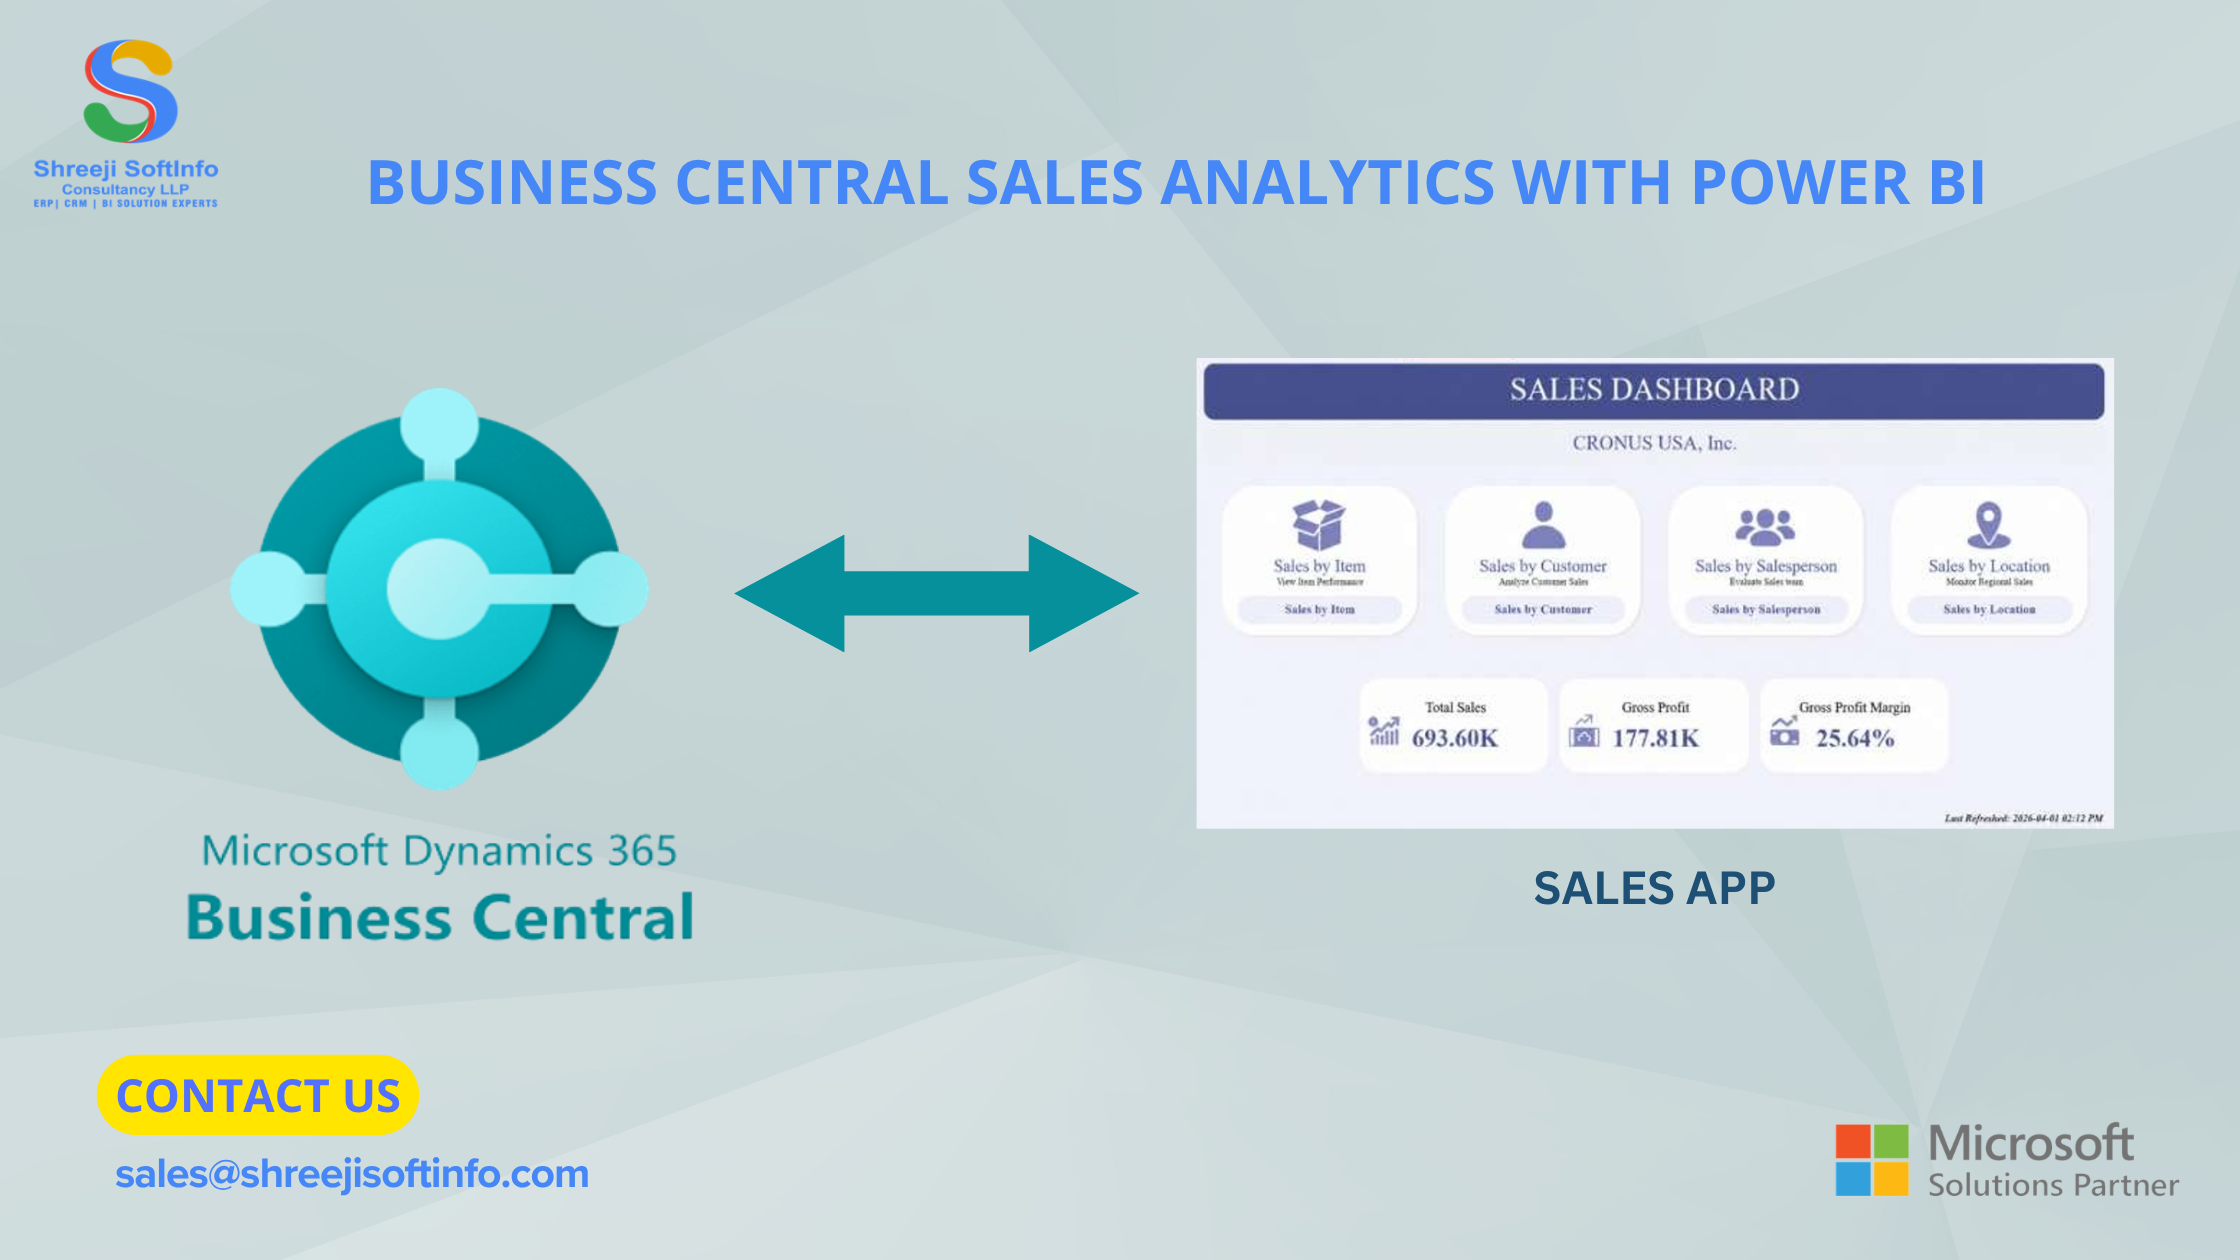
Some of your most crucial business queries already have answers in your Microsoft Dynamics 365 Business Central sales data: Which clients are making fewer purchases? Which goods make the most money overall? Who among the salespeople is falling short? Which areas are expanding? What is the amount of money in open sales orders?
Seldom is a lack of data the issue. Converting thousands or perhaps millions of Business Central transactions into information that business executives and sales managers can comprehend fast enough to take appropriate action is the challenge.
Business Central Sales Analytics with Power BI is useful in this situation. Organizations may create interactive sales dashboards, KPIs, and drill-through reports from sales orders, invoices, credit memos, customers, items, salespeople, and dimensions by integrating Microsoft Dynamics 365 Business Central with Power BI.
Quick Answer: Business Central Sales Analytics with Power BI connects Dynamics 365 Business Central sales data to interactive Power BI dashboards so businesses can analyze revenue, gross profit, customers, items, salespeople, locations, open orders and sales trends, with drill-through to transaction detail.
What Is Business Central Sales Analytics?
Business Central Sales Analytics is the process of transforming sales and related transactional data stored in Dynamics 365 Business Central into measurable business insights.
Business Central captures information throughout the sales lifecycle, including sales quotes, sales orders, shipments, sales invoices, credit memos, customers, items, salespeople, locations, dimensions and value entries.
The objective is not simply to visualize transactions. It is to answer business questions such as why sales changed, which customers contribute the most margin, which items are growing or declining, which salespeople are below target, and how much value is currently sitting in open orders.
Why Connect Business Central Sales Data to Power BI?
Power BI provides a consolidated analytical layer over Business Central data, allowing management to move from operational records to visual, interactive and reusable sales intelligence.
Organizations can analyze sales across Customer, Item, Salesperson, Location, Department, Territory, Business Unit, Company and Date. Power BI can also combine Business Central data with CRM pipeline, budgets, targets, e-commerce and other operational sources.
5 Business Central Sales Reports to Build in Power BI
1. Executive Sales Performance Dashboard
Answers: Are we achieving sales and profitability targets? Track Total Sales, Gross Profit, Gross Margin %, Sales vs Target, Sales Growth %, Average Order Value and Outstanding Sales Orders, with MTD, QTD, YTD, prior-year and budget comparisons.
2. Customer Performance & Retention Analysis
Answers: Which customers generate revenue and profit, and which customers are declining? Track Sales by Customer, Gross Profit, Margin %, Order Frequency, Average Order Value, Last Purchase Date and period-over-period growth. Classify customers as Growing, Stable, Declining or Inactive.
3. Item & Product Sales Analysis
Answers: Which goods are the main drive of profit, volume, and revenue? Examine sales by item, quantity sold, gross profit, gross margin percentage, item category, sales growth, and customer contribution. For high-value items, think about ABC classification.
4. Salesperson & Territory Performance
Answers: Which salespeople and territories are performing against target? Track Sales, Gross Profit, Margin %, Sales vs Target, Customer Count, New Customers and Average Order Value, with drill-down from salesperson to customer, item and transaction.
5. Open Orders & Sales Forecast
Answers: What revenue is expected in coming weeks or months? Analyze Open Sales Orders, Outstanding Order Value, Expected Shipment Date, Customer, Item, Salesperson and Region to support sales, finance, purchasing and operations.
Which Business Central Data Should Power BI Use?
The exact tables or API entities should follow the business definition of the KPI. Typical sales analytics may use sales lines, value entries, posted sales invoice lines, sales credit lines, customers, items, salespeople, locations and dimensions.
- Does Revenue mean ordered, shipped or invoiced sales?
- Are credit memos and returns deducted?
- Which posting date controls the reporting period?
- Which currency should be reported?
- Should margin use expected, actual or adjusted cost?
Define these rules before writing DAX. This prevents the common situation where Power BI and Business Central show different totals.
How to Connect Business Central to Power BI
- Define the Business Questions: Start with the decisions the report must support rather than importing tables first.
- Choose the Data Access Method: Use supported Business Central APIs and analytics endpoints; introduce custom API pages where the reporting requirement needs fields or structures not exposed by the standard endpoints.
- Import Only What You Need: Limit the model to the columns and transactions required by the reporting scope to improve refresh and maintainability.
- Build a Star Schema: Use a central sales fact connected to Date, Customer, Item, Salesperson, Location, Company, Territory and other relevant dimensions.
- Create Standardized Measures: Define Total Sales, Gross Profit, Gross Margin %, Sales LY, YoY Growth %, Average Order Value, Open Order Value and Sales vs Target centrally.
- Validate Against Business Central: Reconcile total sales, customer sales, item sales, credit memos, gross profit and open orders before production deployment.
- Publish, Secure and Distribute: Publish to Power BI, configure refresh, apply role-based security, validate access and distribute the reports to the intended audiences.
From Sales Dashboard to Business Action
Customer Retention
A high-value customer that normally orders every 15 days has not purchased for 45 days. Insight → Account manager follow-up.
Margin Protection
Revenue is increasing while gross margin is falling in one category. Drill-through identifies excessive discounting. Insight → Pricing review.
Sales Management
A territory is below target and the decline is concentrated in a few major accounts. Insight → Targeted account recovery.
Inventory Planning
Open orders show unusually high demand for several items next month. Insight → Purchasing and inventory planning.
Data → Insight → Decision → Action
Common Business Central Power BI Mistakes
- Importing everything: More data often creates a slower and harder-to-maintain model.
- Ignoring Business Central dimensions: Dimensions are one of Business Central’s strongest analytical structures and should be designed into the model.
- Defining revenue incorrectly: Ordered, shipped and invoiced sales are different concepts.
- Ignoring credit memos and returns: Sales can be overstated if credits and returns are not handled correctly.
- Ignoring currency conversion: Multi-company and international reporting needs explicit LCY and reporting-currency rules.
- Designing before validating: Validate the numbers first; then optimize the visual experience.
Shreeji Softinfo: Business Central, Power BI and AppSource
Shreeji Softinfo Consultancy LLP delivers Microsoft business solutions across industries and business functions. Our capabilities span Microsoft Dynamics 365, Power Platform, Power BI, Microsoft Fabric, Azure, ERP, CRM and AI & Copilot solutions.
For Business Central sales analytics specifically, Shreeji Softinfo has also published Sales Insights for Dynamics 365 Business Central on Microsoft AppSource. This positions the solution as a productized sales analytics offering while Shreeji Softinfo remains a broader Microsoft technology and digital-transformation consultancy.
A typical analytics engagement can include business and KPI discovery, Business Central data assessment, API/data integration, semantic modelling, DAX and KPI development, dashboard development, ERP-to-Power BI validation, security, deployment and user training.
Ready to Turn Business Central Sales Data into Decisions?
Shreeji Softinfo can help transform Business Central data into interactive Power BI sales analytics covering Executive Sales, Customer Performance, Salesperson Performance, Regional Analysis, Item & Category Analysis, and Gross Profit & Margin reporting.
Frequently Asked Questions
1. Can Business Central connect directly to Power BI?
Yes. Business Central supports Power BI integration through Microsoft-supported APIs and analytics capabilities, with custom APIs available for more specialized reporting requirements.
Start with Total Sales, Gross Profit, Gross Margin %, Sales Growth, Sales vs Target/Budget, Sales by Customer, Sales by Item, Sales by Salesperson and Open Order Value.
2. Can Power BI analyze Business Central sales by customer?
Yes. Customer analytics can include sales amount, quantity, cost, gross profit, margin, purchase frequency, last purchase date and growth or decline trends.
3. Can Power BI show customer retention?
Yes. Retention-oriented dashboards can identify repeat-purchase behavior, declining order frequency, inactive customers and churn signals.
4. Can Power BI analyze open Business Central sales orders?
Yes. Open-order analytics can show outstanding order value, expected shipment dates, customer, item, salesperson and region.