
In Analysis Mode—typically referring to tools like Power BI, Tableau, Business Central list page or other data modelling environments—”Add fields from related tables” means incorporating data from tables that are connected through relationships (usually via primary and foreign keys) into your current analysis or visualization.
Here’s a breakdown of what this means:
1. Related Tables
These are tables that are connected through a relationship, often defined by:
- Primary Key in one table
- Foreign Key in another
For example:
- Customers table (CustomerID as primary key)
- Orders table (CustomerID as foreign key)
2. Adding Fields
When you “add fields from related tables,” you’re:
- Pulling in columns (fields) from a table that is not the main table in your current analysis.
- This is possible because of the relationship between the tables.
3. In Practice (e.g., Power BI)
- You might be analyzing Orders, but want to include Customer Name from the Customers table.
- If a relationship exists, you can drag Customer Name into your report or use it in a DAX formula.
- The system understands how to join the data behind the scenes.
In Microsoft Dynamics 365 Business Central, when you’re in Analysis Mode such as when working with list pages, reports, or analysis views.
The option to “Add fields from related tables” allows you to enhance your data analysis by including fields that are not directly in the current table but are accessible through relationships.
Including data fields from other tables that are linked to the current table through predefined relationships (like foreign keys), without manually joining or modifying the data model.
Why It’s Useful
- Avoids data duplication: You don’t need to merge tables manually.
- Keeps models clean: You can maintain normalized data structures.
- Enables richer insights: Combine data from multiple sources easily.
- Saves time: No need to write code or create custom reports.
- Changes done by single user: Enables self-service analytics for users.
- Reduce error: Keeps data consistent and avoids duplication.
How It Works:
- Business Central has a relational data model.
- Tables like Sales Header, Sales Line, Customer, Item, etc., are connected.
- When analyzing data (e.g., in a list page or analysis view), you can add fields from related tables using the “Personalize” or “Analysis Mode” features.
Example:
You’re analyzing the Sales Orders list and want to include the Customer Name (which is stored in the Customer table).
- You click “Add fields”.
- Choose “Show more fields”.
- Navigate to related tables like Customer.
- Select Customer Name and add it to your view.
Business Central automatically uses the relationship between Sales Header and Customer to pull in the correct data.

Here’s a step-by-step guide to add fields from related tables in Analysis Mode in Microsoft Dynamics 365 Business Central.
Step-by-Step Guide to Add Fields from Related Tables
Step 1: Open a List Page
- Navigate to a list page where you want to analyze data.
- Example: Sales Orders, Posted Sales Invoices, Items, etc.

Step 2: Enter Analysis Mode
- Click on the “Analyze” button (usually found in the top-right corner).
- This switches the view into Analysis Mode, where you can customize columns and perform ad-hoc analysis.
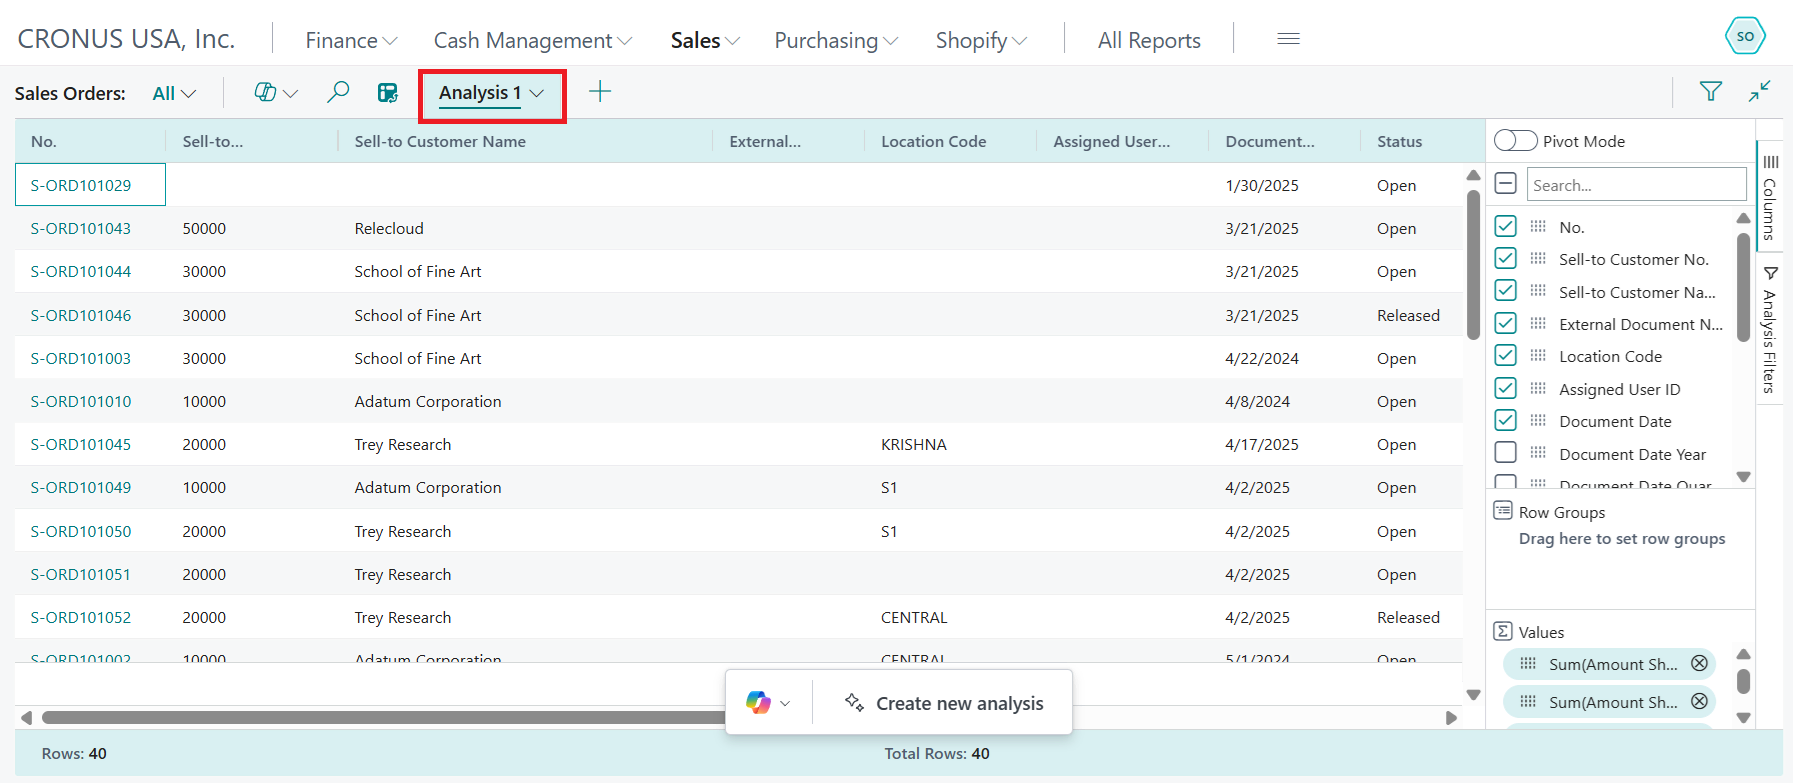
Step 3: Add Fields
- Click on “+ Add fields” in the analysis pane.
- A panel will open on the right side showing available fields.
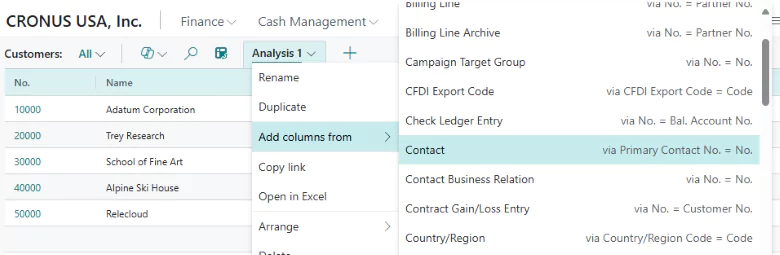
Step 4: Show More Fields
- Scroll down and click “Show more fields” to expand the list.
- You’ll see fields grouped by table names.
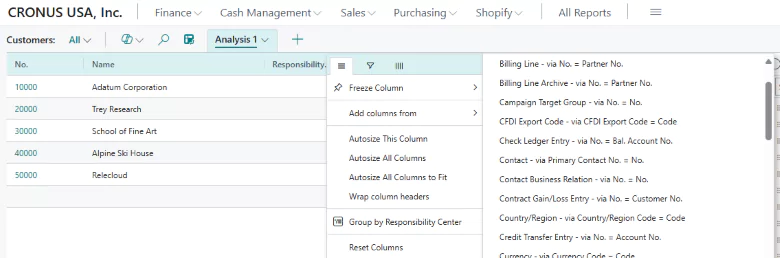
Step 5: Navigate to Related Tables
- Look for related tables like:
- Customer
- Item
- Vendor
- Contact
- Salesperson
- These are linked to your current table via relationships
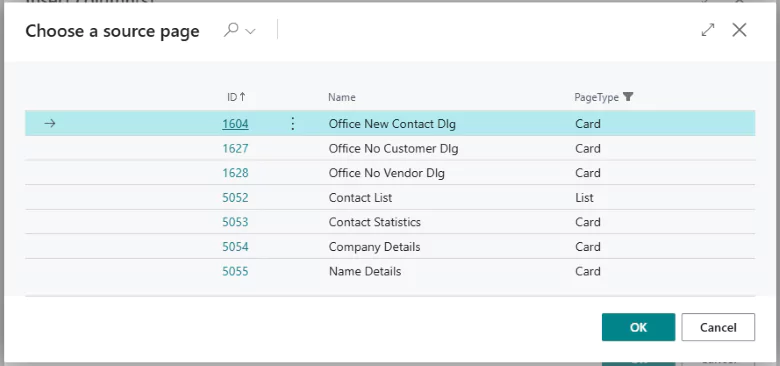
Step 6: Select Fields from Related Tables
- Expand a related table (e.g., Contact).
- Select the fields you want to add (e.g., Contact list, Contact statistics etc.).
- Click “Add” or drag them into the analysis view.
Step 7: Analyze Your Data
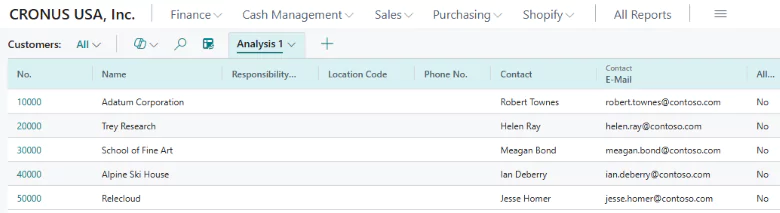
- The selected fields now appear in your analysis grid.
- You can sort, filter, and group by these fields just like native ones.
Tips:
- You don’t need to modify the data model—Business Central handles the relationships automatically.
- You can save your analysis view for future use.
- Use filters to narrow down data based on the newly added fields.