
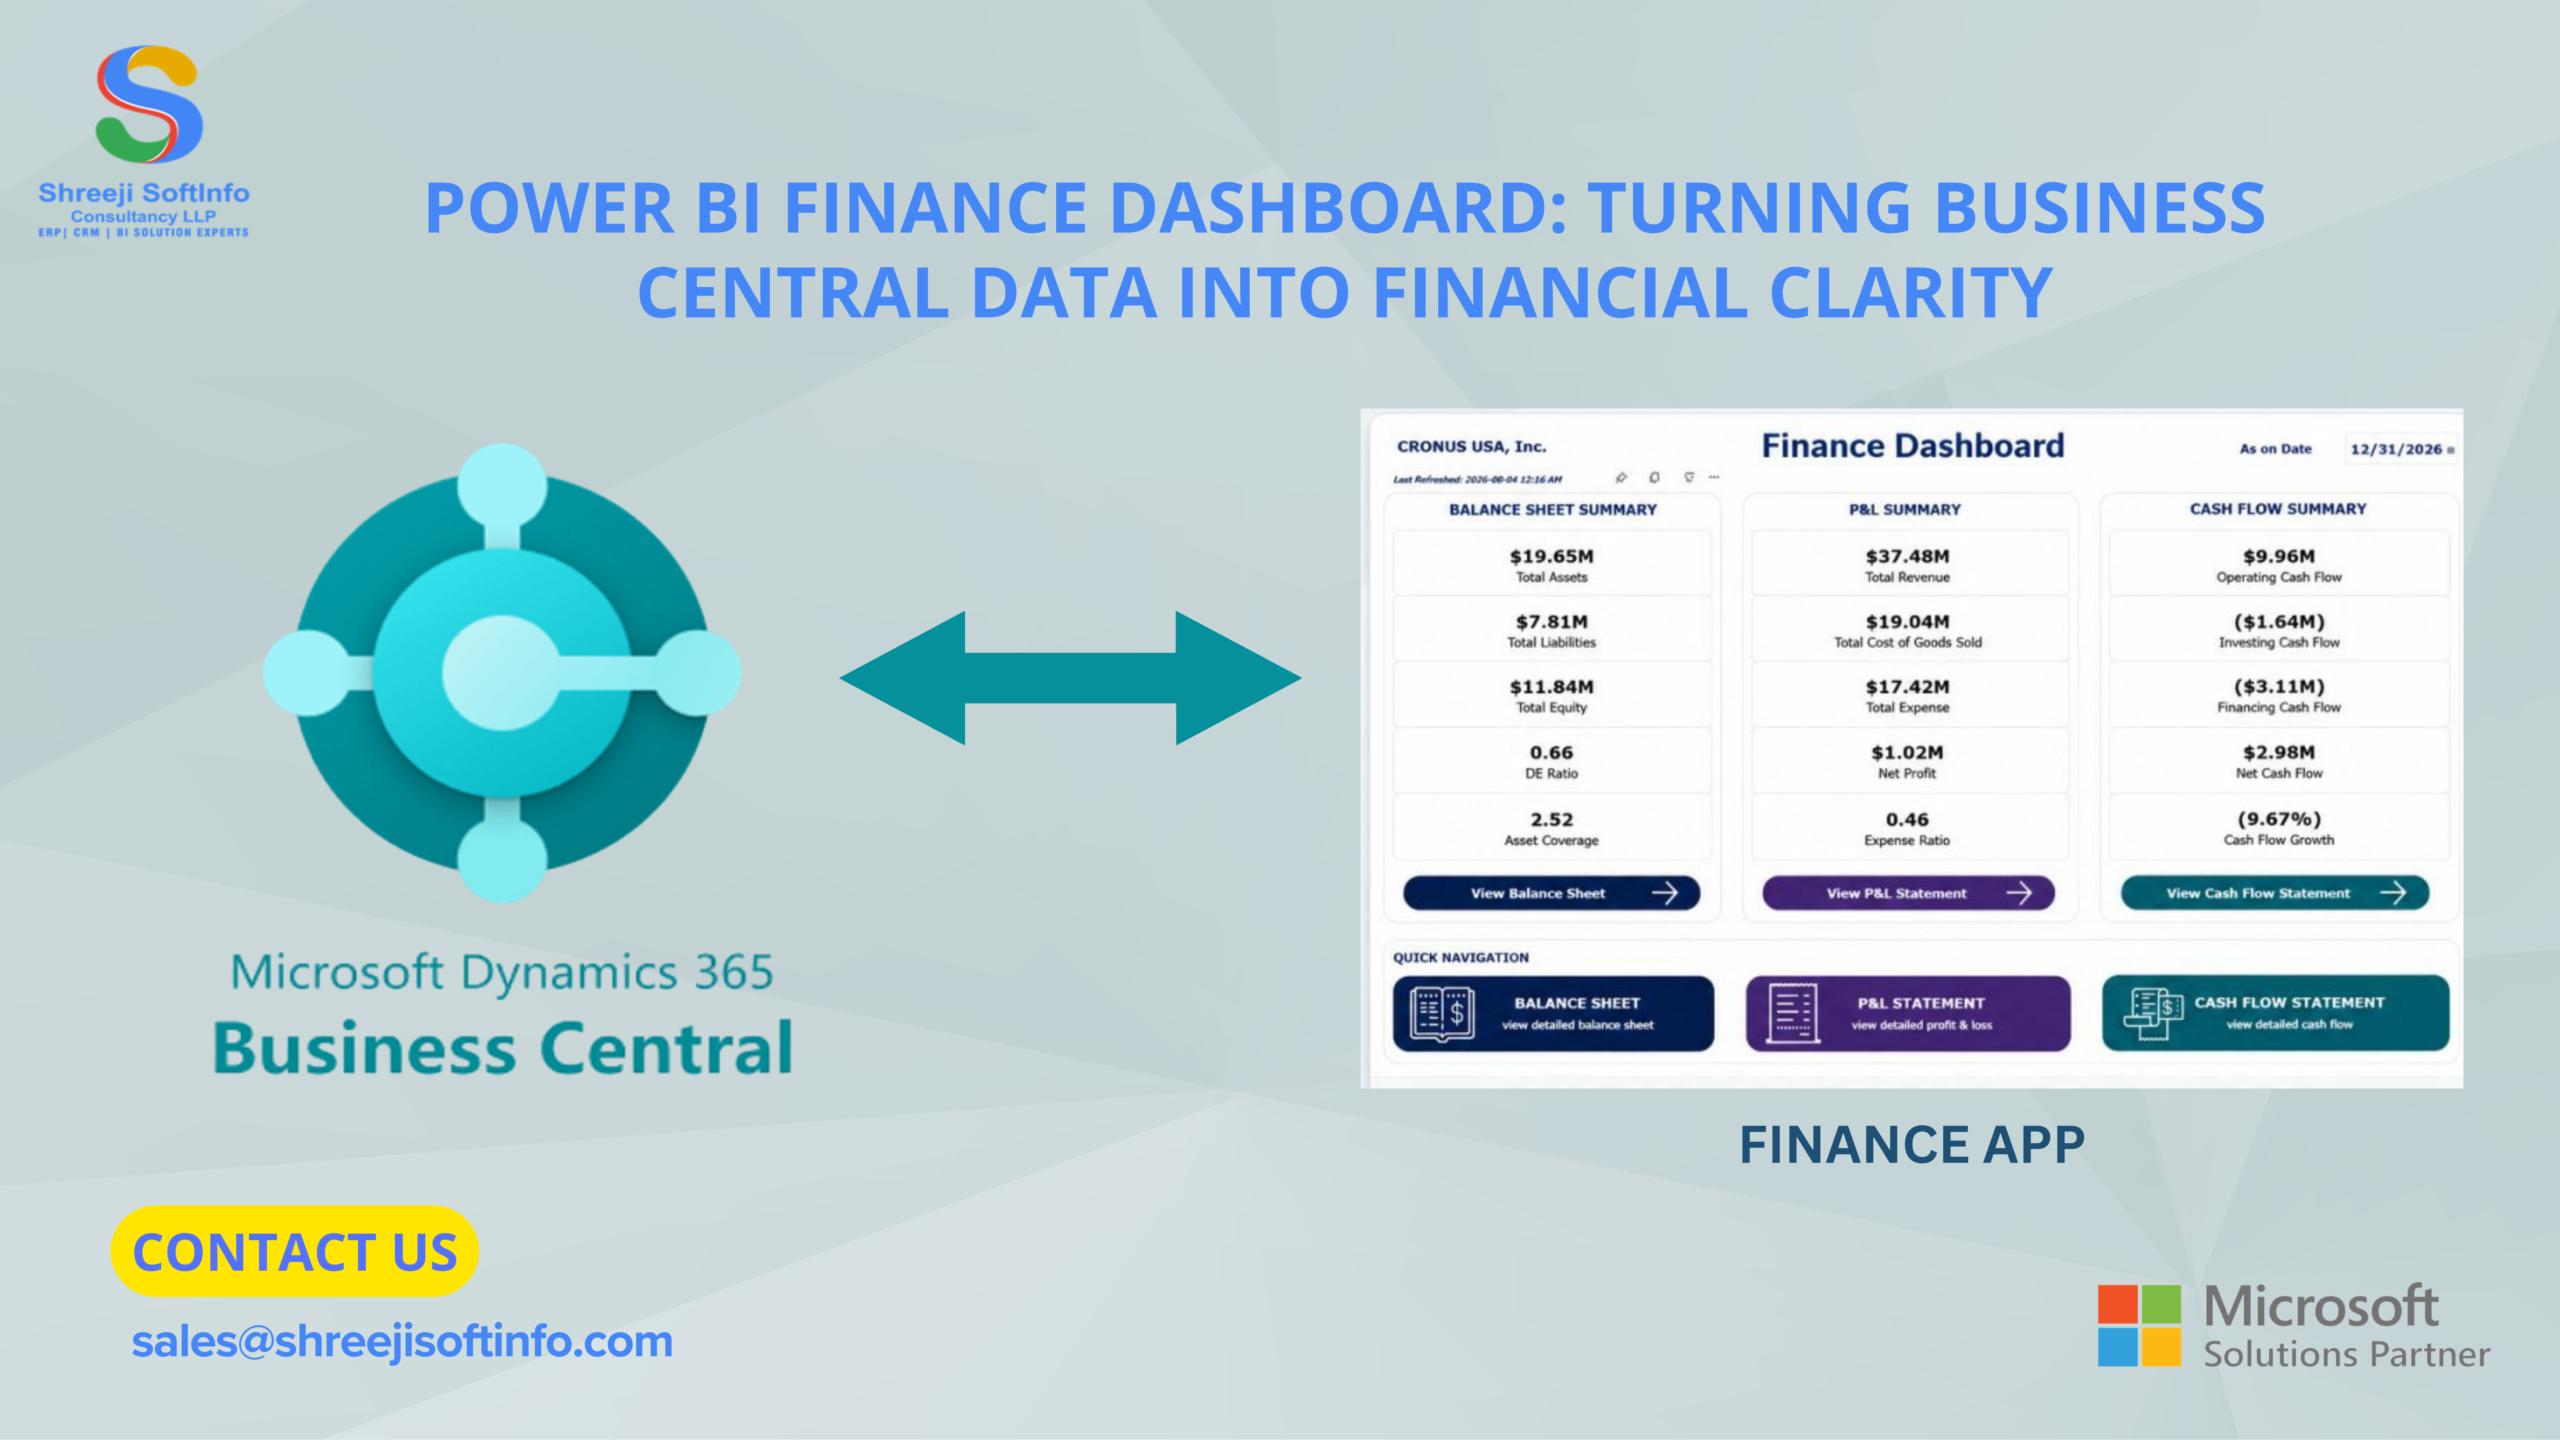
The majority of finance teams using Dynamics 365 Business Central have plenty of data. They don’t have enough time to understand it. By combining your general ledger, payables, receivables, and budget data into a single, dynamic display, a Power BI finance dashboard fills that gap. It only takes a few seconds to answer the question “where do we actually stand right now?” instead of a week of spreadsheet effort.
This post explains how to link Business Central to Power BI, what constitutes a successful finance dashboard, which KPIs belong on it, and the subtle errors that cause consumers to lose faith in the figures.
Key takeaways
- A Power BI finance dashboard turns posted Business Central transactions into live KPIs you can drill into, down to the individual ledger entry.
- Start with six to eight KPIs covering profitability, cash, receivables, payables and budget variance.
- You can connect through Microsoft’s prebuilt Power BI apps for Business Central or build a custom model with the Business Central connector in Power BI Desktop.
- Trust comes from reconciliation: the dashboard should always tie back to the Business Central trial balance.
What Is a Power BI Finance Dashboard?
A Power BI finance dashboard is an interactive report that shows an organisation’s core financial data in one place and refreshes automatically from the source system. That data typically includes revenue, expenses, margins, cash position, receivables and payables. When the source is Business Central, every chart traces back to real posted entries in your general ledger and sub-ledgers.
Technically, Power BI separates “reports” (multi-page analysis) from “dashboards” (a single screen of tiles pinned from reports). In everyday finance conversations people use “dashboard” for both, and that is perfectly fine. What matters is that leadership gets a clear summary and analysts get the detail underneath it.
Why Business Central Data Needs Power BI
When it comes to transaction recording, Business Central excels. They don’t have enough time to understand it. By combining your general ledger, payables, receivables, and budget data into a single, dynamic display, a Power BI finance dashboard fills that gap. It only takes a few seconds to answer the question “where do we actually stand right now?” instead of a week of spreadsheet effort.
Daily tasks are effectively managed by its role centers and regular reporting. Analysis across time, entities, and dimensions in a manner understandable to non-accountants is where it falters.
You will notice the pattern if exporting a trial balance to Excel and rebuilding pivot tables are still part of your month-end pack. The numbers don’t match by the time the pack is completed because someone posted a late journal. To break that cycle, Power BI adds:
- Drill-down: click from a revenue total to a department, then to a customer, then to the G/L entries behind it.
- Blended data: combine Business Central figures with CRM pipeline, payroll or Excel budgets in a single model.
- Scheduled refresh: the data updates on a set timetable without anyone pressing export.
- Row-level security: a regional manager sees only their region, while the CFO sees everything.
- Mobile access: the same dashboard works on a phone before a board meeting.
Key KPIs for Your Power BI Finance Dashboard
A common failure is trying to show everything. A better approach is to answer the four questions leadership asks every month. Are we profitable? Do we have cash? Are customers paying? Are we on budget?
Profitability
Track revenue, gross margin percentage, operating expenses and net profit, each compared with the prior period and with budget. A rolling 12-month trend line shows direction far better than a single month ever can.
Cash and liquidity
Show the current cash balance, the current ratio and working capital. If your business carries inventory, the cash conversion cycle is worth its own card because it connects stock, receivables and payables in one number.
Receivables and payables
Days sales outstanding (DSO) and aged receivables buckets (current, 30, 60, 90+ days) tell you who owes money and for how long. On the other side, days payables outstanding (DPO) and overdue payables help you plan payments without damaging supplier relationships.
Budget vs actual
Variance by G/L account and by dimension, such as department or project, is where Business Central data really shines. Because dimensions are tagged on every posting, Power BI can slice variance in ways a flat trial balance simply cannot.
How to Connect Business Central to Power BI
There are three practical routes, and the right one depends on how custom your reporting needs are.
- Prebuilt Power BI apps for Business Central. Microsoft offers ready-made apps, including a Finance app, that install from AppSource and connect to your environment. This is the fastest way to get a working view.
- Custom model in Power BI Desktop. Use the built-in Dynamics 365 Business Central connector to pull exactly the tables you need and design your own layout.
- Data warehouse or Microsoft Fabric. For multi-company groups or large data volumes, staging data first gives better performance and easier consolidation.
For a custom build, the workflow usually looks like this:
- In Power BI Desktop, choose Get Data, then Dynamics 365 Business Central, and sign in with your Microsoft Entra ID account.
- Select the environment and company. Then load G/L entries, G/L accounts, customer and vendor ledger entries, dimension values and budget entries.
- In Power Query, create a proper date table and map G/L accounts to reporting categories such as revenue, cost of sales and overheads.
- Build a star schema, with G/L entries as the fact table and accounts, dates, dimensions and companies as lookup tables.
- Write DAX measures for each KPI. Then publish to the Power BI service, set scheduled refresh and apply row-level security.
Design Principles That Create Financial Clarity
Clarity is a design decision, not a by-product. A few principles make a big difference:
- Lead with the answer. Put headline KPI cards across the top row, each showing the comparison to prior period and budget.
- Fix the signs. Business Central stores revenue as credits, which means negative numbers. Flip them in your measures so revenue reads as positive and nobody has to do mental gymnastics.
- Use colour with purpose. Keep the palette neutral and reserve red and green for variance only.
- Make it auditable. Add drill-through pages that end at ledger-entry level, so any number can be explained in under a minute.
- Show the refresh time. A visible “last updated” stamp prevents arguments about whether the data is current.
Common Mistakes to Avoid
Most dashboards fail not because of bad visuals, but because of small data issues that erode trust over time.
- Unmapped accounts. A new G/L account gets created, nobody updates the mapping, and totals stop matching the trial balance.
- Ignoring currency. In multi-currency setups, be clear whether you report in local currency (LCY) or an additional reporting currency.
- Overloading the landing page. Twenty visuals on one screen means nobody reads any of them.
- No reconciliation check. Build a simple measure that compares the dashboard total with the Business Central trial balance and flags any difference.
What This Looks Like in Practice
Picture a mid-sized distributor running three companies in Business Central. Before Power BI, the controller spent the first week of each month consolidating spreadsheets. After building a finance dashboard on a single model, the board sees consolidated margin, cash and DSO on one page. The controller now spends that week on analysis instead of assembly. The data did not change. The visibility did.
Conclusion
A well-built Power BI finance dashboard does more than make Business Central data look good. It shortens the distance between a transaction being posted and a decision being made. Start with a handful of KPIs that answer real leadership questions. Connect through the route that fits your complexity, and build reconciliation into the model from day one.
Ready to see your Business Central numbers clearly? Talk to our team about designing a Power BI finance dashboard tailored to your chart of accounts, dimensions and reporting needs.
Frequently Asked Questions
Q: Can Power BI connect directly to Business Central?
Yes. Power BI Desktop includes a built-in Dynamics 365 Business Central connector. It signs in with your Microsoft account and reads data through Business Central APIs and published web services. No third-party tool is required for most setups.
Q: Is there a ready-made Power BI finance dashboard for Business Central?
Yes. Microsoft provides prebuilt Power BI apps for Business Central, including a Finance app, available through AppSource. They are a quick starting point, though most companies customise them to match their own chart of accounts and KPIs.
Q: How often does a Power BI finance dashboard refresh?
It depends on your licence. With Power BI Pro you can schedule up to 8 refreshes per day, while Premium capacity allows up to 48. Most finance teams find a few refreshes per day is plenty.
Q: Which KPIs should a finance dashboard include?
Start with revenue, gross margin, operating expenses vs budget, net profit, cash balance, DSO, DPO and aged receivables. These cover profitability, liquidity and working capital, which are the questions leadership asks most often.
Q: Do I need a data warehouse to build a Power BI finance dashboard?
Not always. Single-company businesses with moderate data volumes can connect Power BI straight to Business Central. A data warehouse or Microsoft Fabric becomes worthwhile for multi-company consolidation or very large transaction volumes.